Introduction
Our games range from providing a light-hearted change from the serious nature of trading to games that are challenging and require an extremely adventurous spirit.
All our games, now matter how sophisticated, have a common characteristic:
the maximum loss is constrained to the trader’s investment.
the maximum gain is also known although there are numerous strategies on offer where the strategy is an aggregate of individual strategies, each of which can win or lose independently of the others.
Most of our games will be constrained to forecasting the future price and/or path of an FX pair. Yet other assets, for example, oil, BTC, stock market indices, a few major US equities, can be included. The criterium is whether the underlying asset price is sufficiently liquid to not be affected by an individual trader who has a position in a game.
Time frames of the strategies are short. All our games have a high gamma which generates excitement. Our games will not be attractive to the traditional buy-and-hold investor (unless they’ve become bored out of their minds ‘watching paint dry’ and fancy a bit of an adrenalin rush!).
FXT-PRO
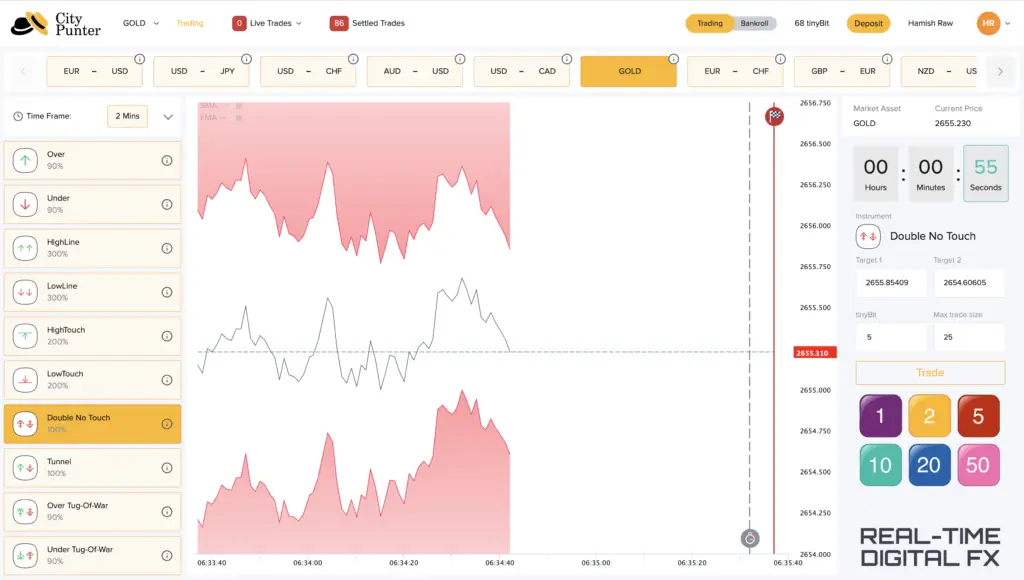
Left Image: FX-PRO shows 10 different strategies on the left. Double No-Touch is chosen. The price (black) must not go into the red above or below.
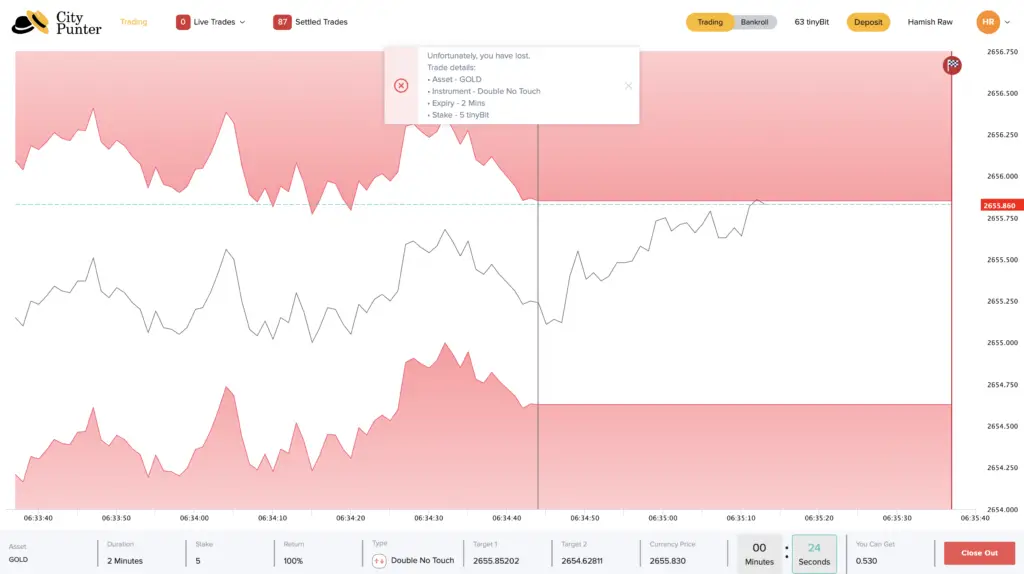
Right Image: The trader has invested 5 at the point of the vertical black line. The above and below red areas are now fixed. The price travels up and the upper red area is touched. Player loses their investment.
Risk Manager
On the above top left screen you will see that the odds on offer are skewed with, for example, the Over offering only XX% compared to the Under which is offering XX%. This is the result of the risk manager analysing the broker’s risk across all traders with positions in 2 minute Gold. The weight of money is speculating that the price will be higher so that is where the broker’s risk is. So to ‘flatten’ the book they bid up the Under’s return while lowering the over’s return.
User Interfaces
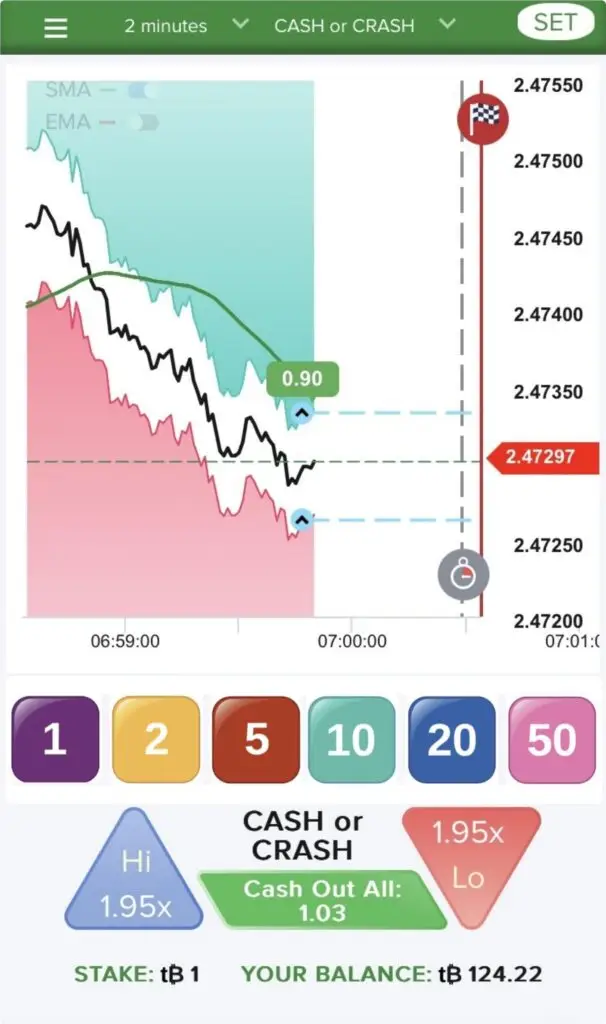
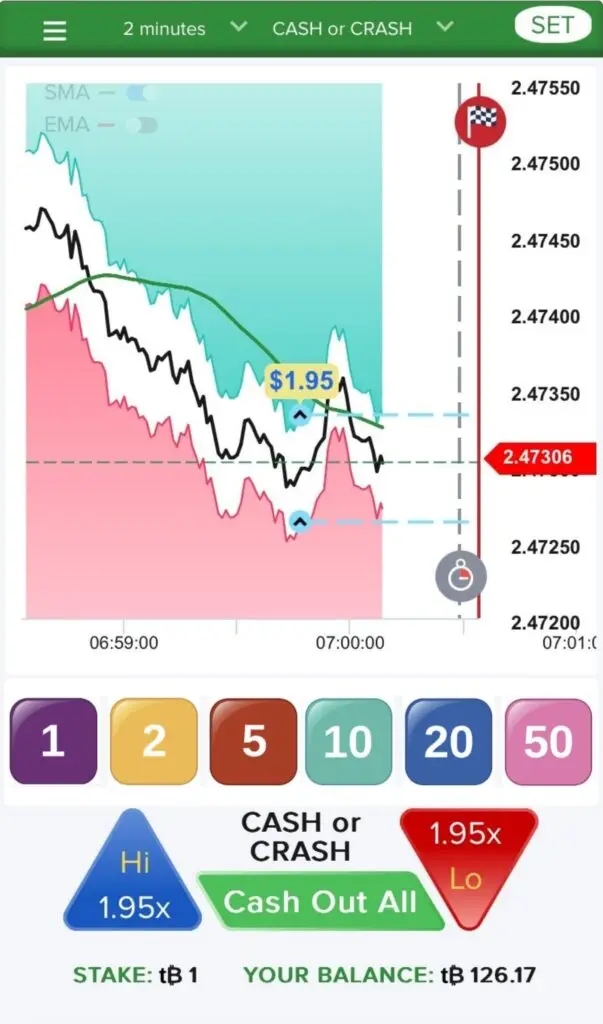
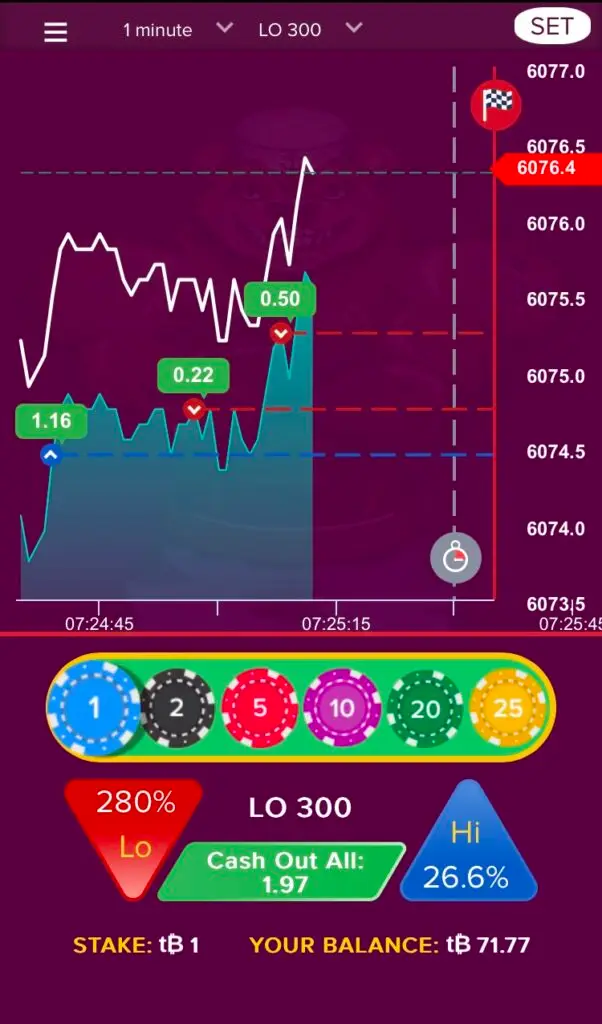
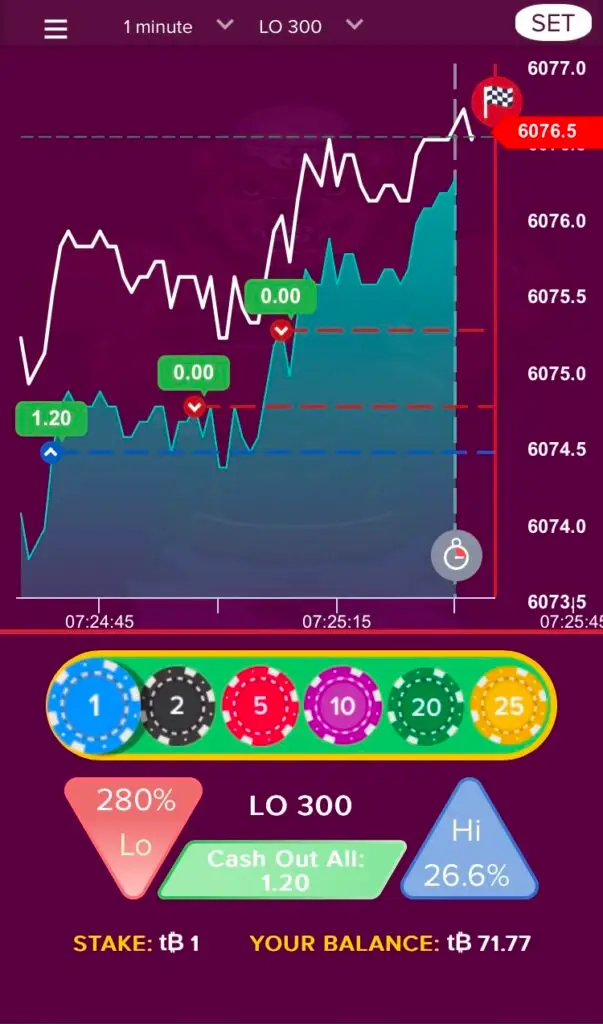
Trading Games welcomes the opportunity to deliver bespoke UIs based on the broker’s design. The two examples below showcase just two UIs that have been created to the customers request.
Both of these particular designs were requested for the games that were on offer at weekends when no real assets could be (safely) offered. The design on the right even includes casino chips to reinforce the point that the trader is now gambling as the prices are generated using an algorithm within which sits a random number generator.
TUNNEL TRADER
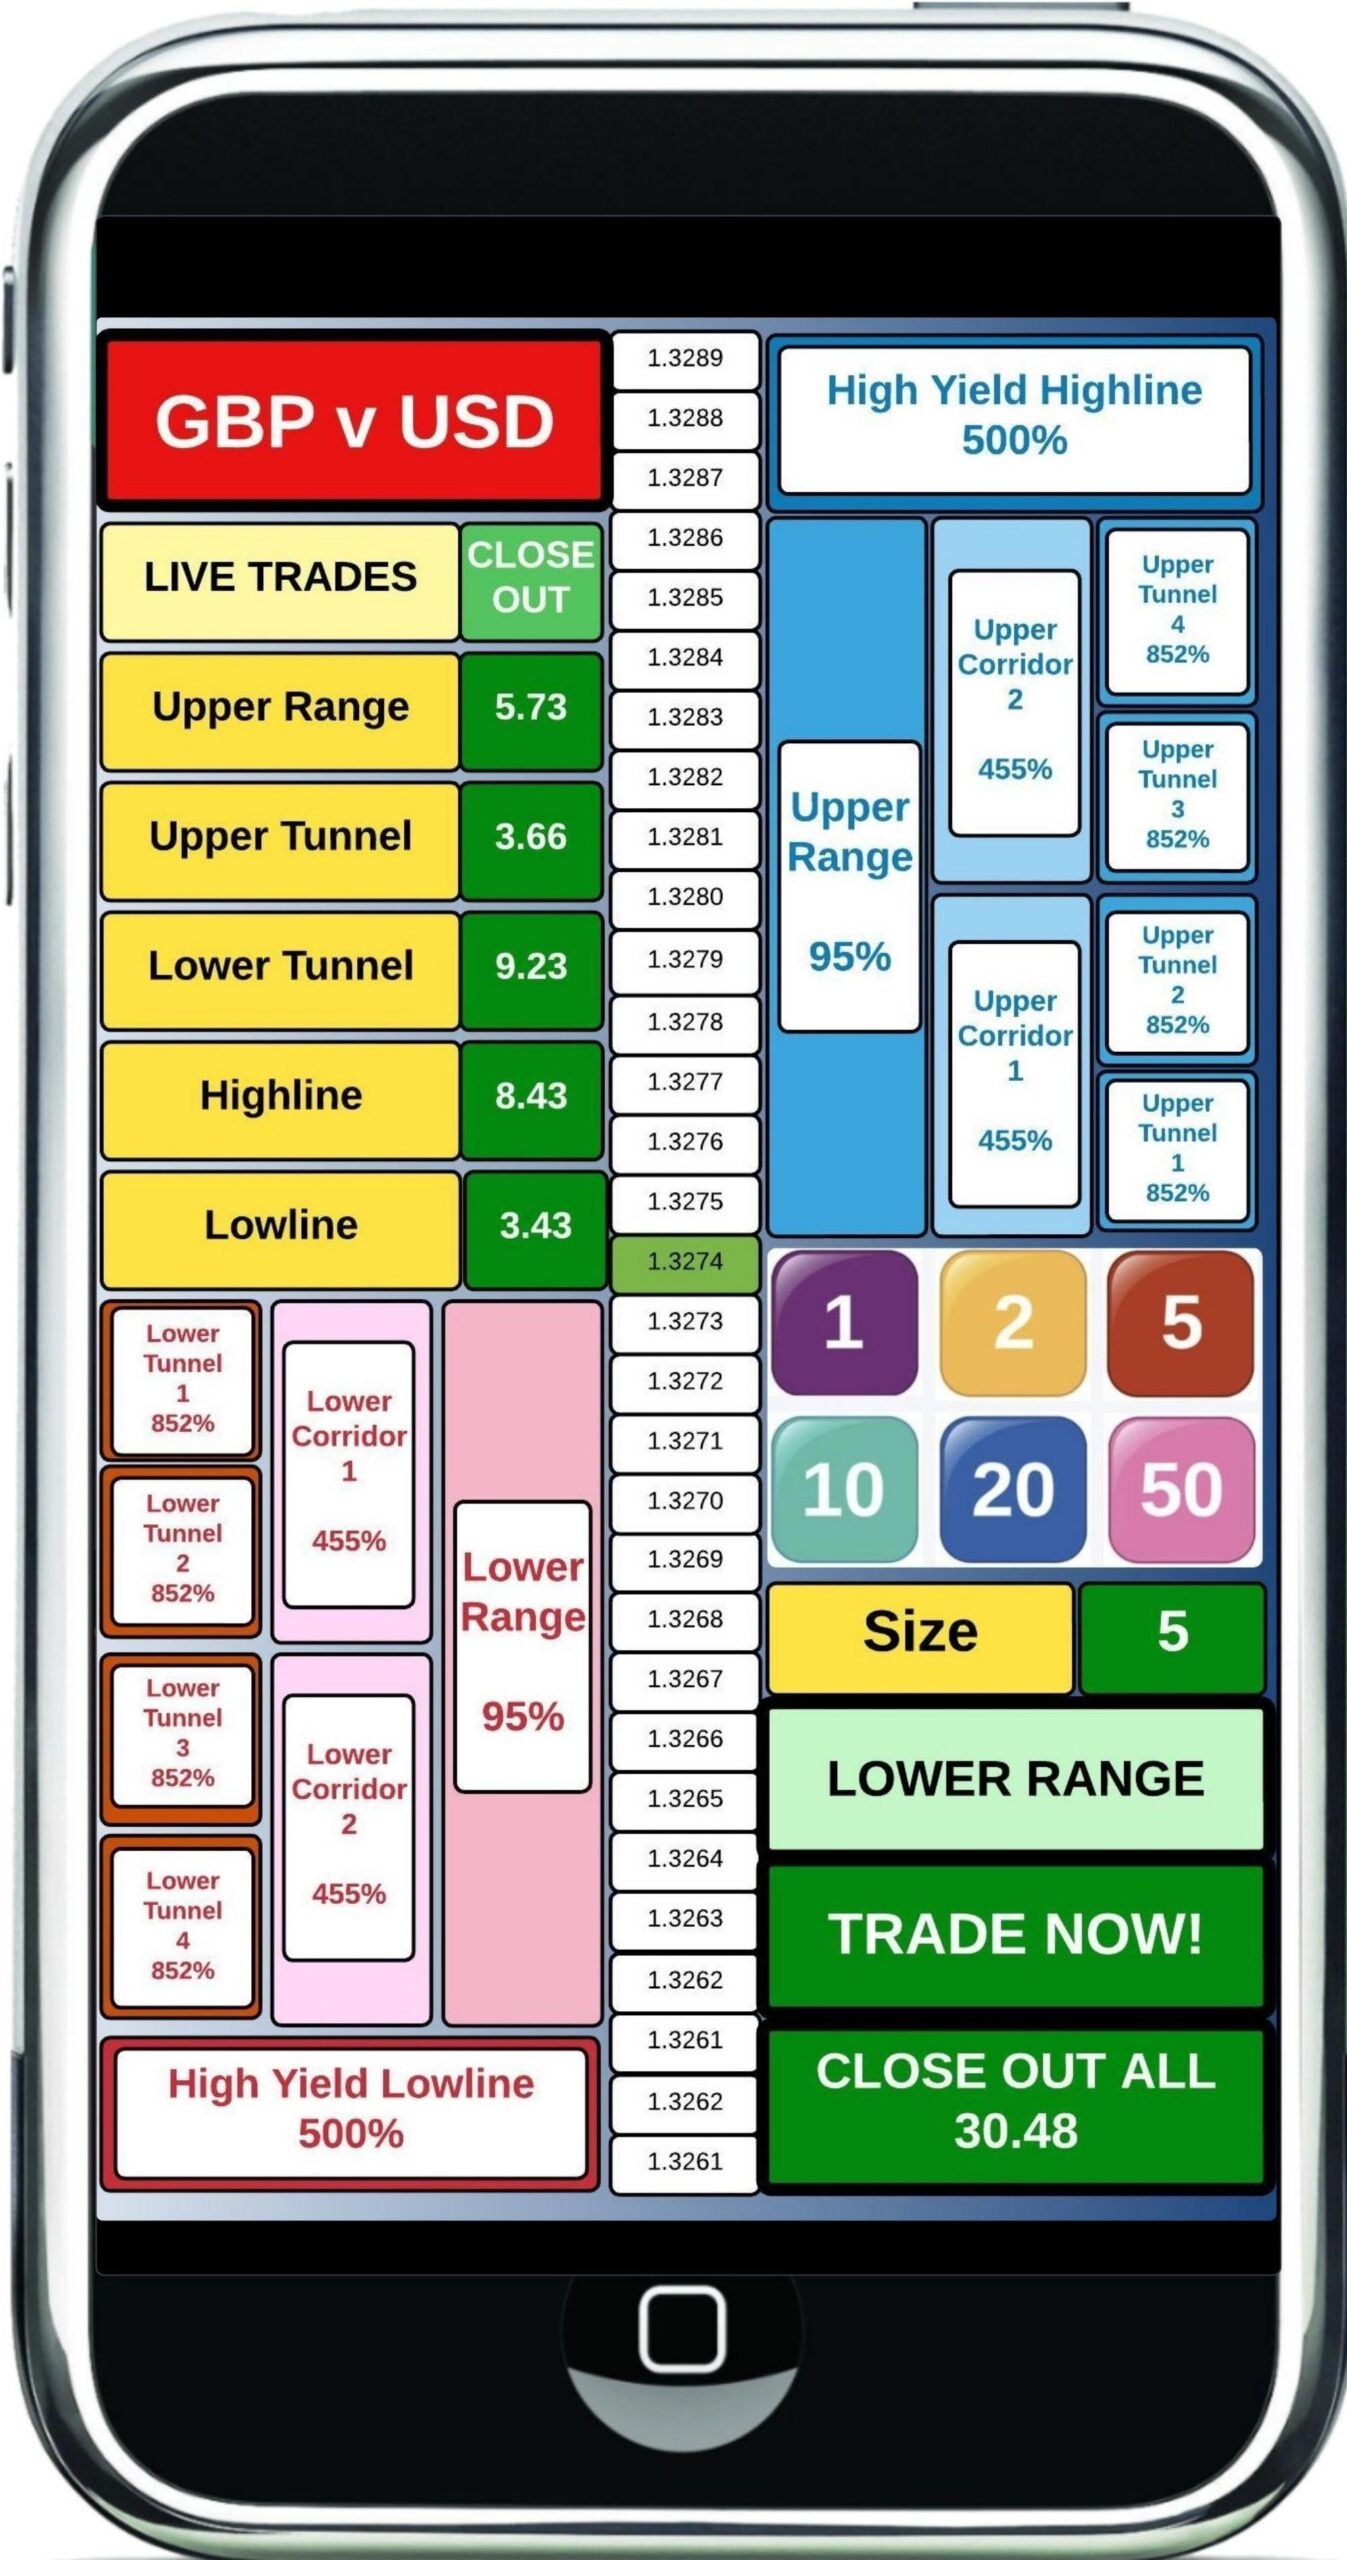
The Tunnel Trader(“TT”) game is portrait so mainly suitable for mobile handset.
The only moving part is the vertical price ladder running the full length of the UI.. The current price is 1.3274 so if the price of cable rises to 1.3275 the whole ladder slides down a pip so that 1.3275 is now in green and the central focal point of the UI..
The trader has 16 different strategies to choose from. On the upside (blue) they consist of:
1 x Upper Range
2 x Upper Corridor
4 x Upper Tunnel, and
1 x High Yield Highline.
The downside offers the same.
The bottom right hosts the order ticket where size of the investment is chosen and the Trade Now call to action.
Right down at the bottom right is a ‘Close All’ button which enables the trader to get out of all positions at the press of the button.
Top left are the trader’s open positions. The trader is permitted a maximum of five for each cycle. By clicking on the square dark green box enable the trader to close out that individual position at roughly the amount in the box.
FINETTE
This strategy we call ‘Finette’ as it is financials aligned with a form of roulette.
In the interbank FX options market is a strategy called a Dual Digital. This is a strategy with two assets and the trader has to speculate in what quadrant the asset price will be at the expiry of the option.
The market-maker creating the price will have to take into account not only the volatility of the two assets but also the correlation coefficient of their prices.
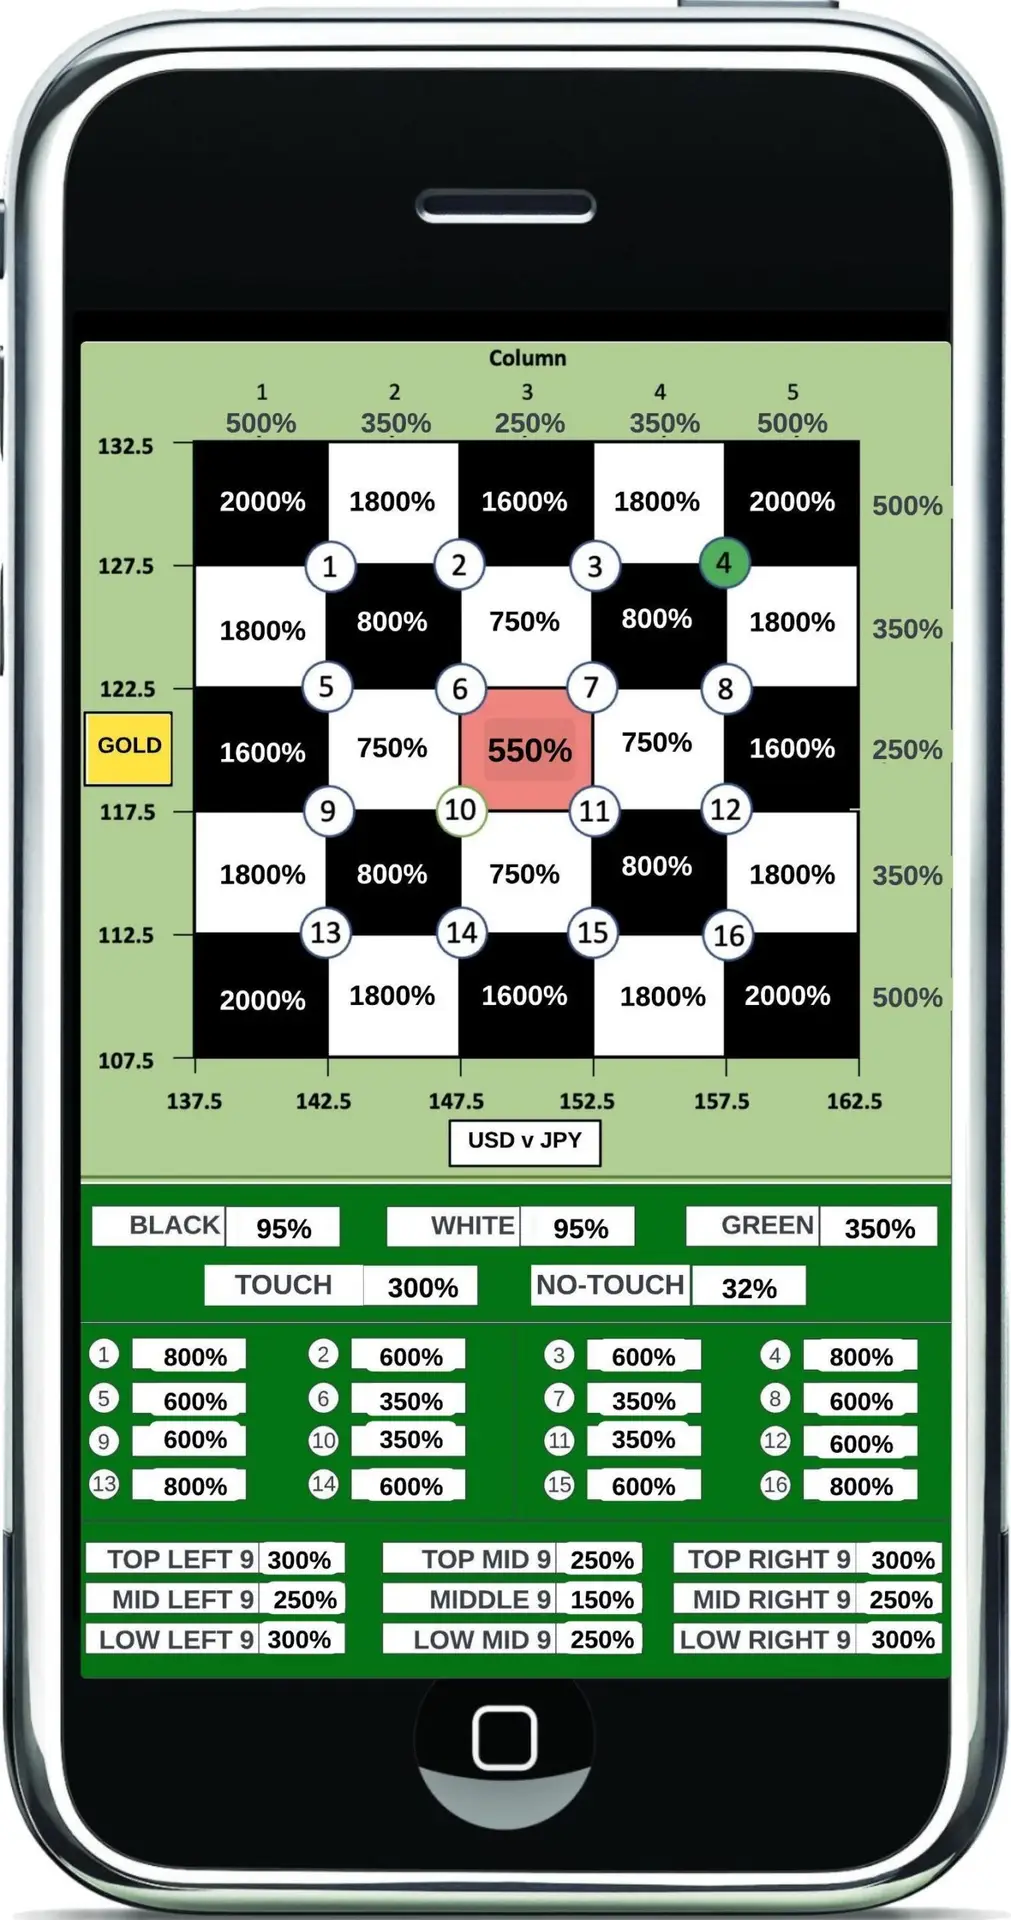
On the left we see the user interface. But instead of a quadrant we now have a 5×5 square with a pale green for the outliers.
At the start of the strategy, in this case based on the prices of Gold and the USD/JPY exchange rate, the current prices of each will intersect at the centre of the pink square in the middle.
If we assume that the correlation coefficient (“co-co”) is zero, i.e. that there is no directional relationship between the movement of the asset prices, then the probability of the two prices ending on squares 1:1, 1:5, 5:1 & 5:5 (2,000% return) would be equal. If the co-co was +1 then the probability of the two prices ending up in 5:1 would be that same as in 1:5. And if the co-co was -1 then the probability of 1:1 would be the same as 5:5.
The player can also take a punt that one or other or both prices are in the green (350%) and there are also prices on black or white.
The four squares (1:1, 2:1, 1:2, 2:2) are around the button ‘1’ so which would be a winner (800%) if the two prices end up in that 2×2 quadrant.
Right at the bottom of the ‘cloth’ we see the prices for the 3×3 quadrants.
Finally the trader can bet whether it will, at any time, venture into the green prior to expiry. So we also have dual barriers. Or touch bets!
The pairs that are popular could be Gold and US 10year Notes, Oil and the S&Ps, the Hang Seng v Straits Index, or for that matter and two Far Eastern indices.
SPRINT
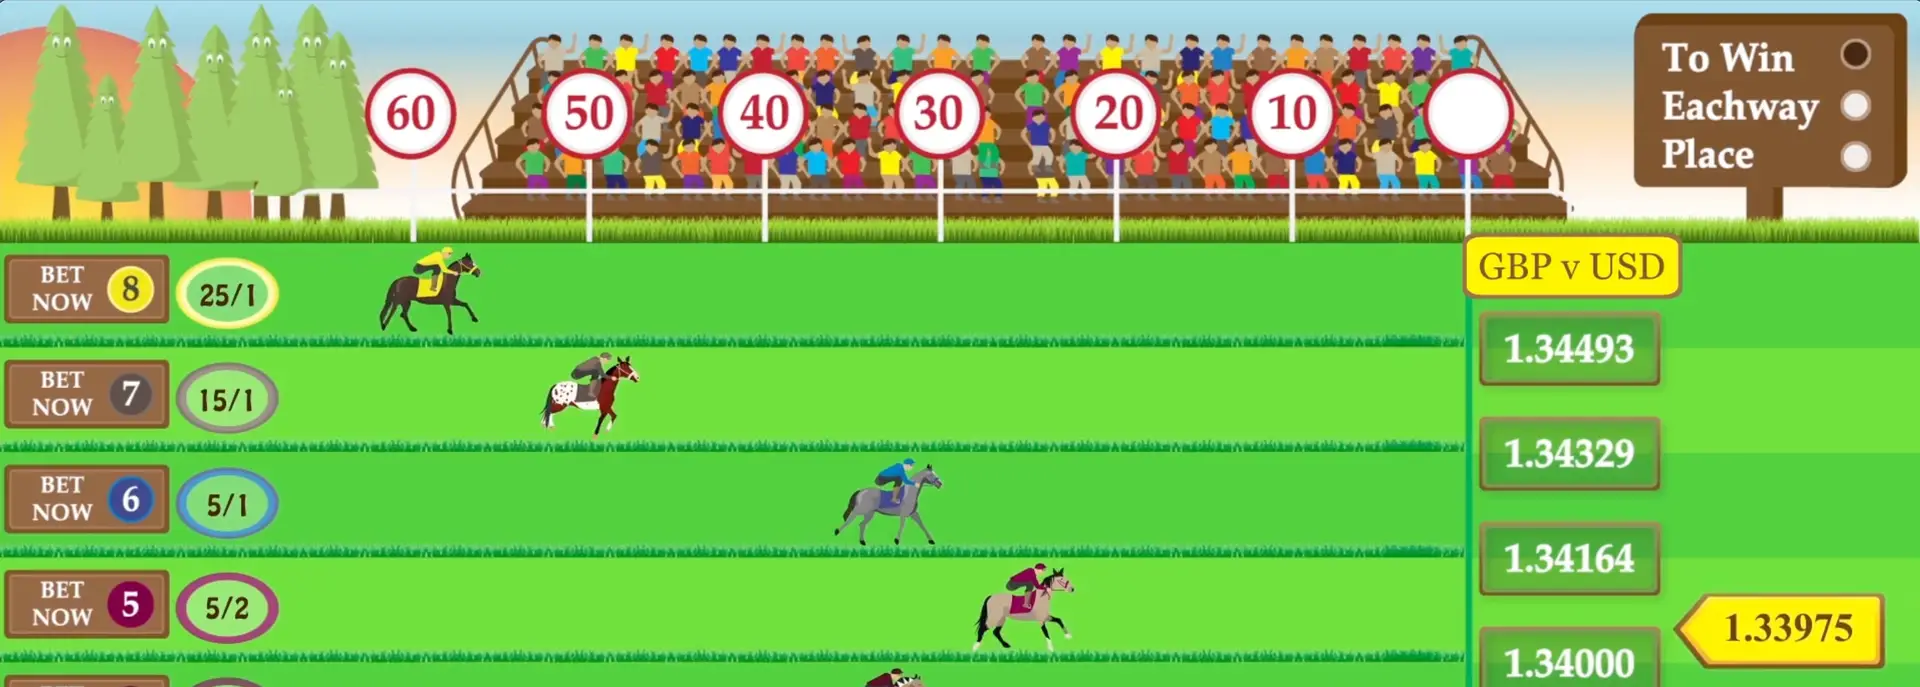
1 minute Sprints are an entertaining means for the trader to take ultra short-term trades on FX and other indices.
The trader can choose ‘To Win’, ‘Eachway’ or ‘Place’.
‘To Win’ requires the price (1.34130) to be in between the strike prices at the end of each snail’s lane. For example, the snail in lane 4 (on the snail’s cap!) wins and all other snails lose.
If the trader chooses the ‘Eachway’ strategy and were to bet on snail 3 or snail 5 then since snail 4 won they would get 40% of the price they bet on.
Finally ‘Place’ means that if the trader had bet on lane 3, 4 or 5 then the player would get paid out on stake and winnings.
There is obviously a huge selection of race contestants (dragons and Father Christmas’s) and financials assets to bet on. Above the snails should possibly be racing in the CAC40 Chase. Maybe the dragons below should be based on the Hang Seng Index. As for Father Christmas’s……..Norwegian Krone to Sweden Krona?
BOXTRADE
BoxTrade is a conditional strategy based on predicting an initial forecast of where the asset price will be at a specific point in time. If this initial hurdle is successfully negotiated, a further five hurdles can now be available to negotiate.
In the above animation the trader has chosen ‘Over’ and ‘Miss’ which means the price has to travel over the point ‘B’ in the ‘AB’ plane and must then miss the top of the box ‘BC’.
Stage 1 (B1), stage 2 (B2) and stage 3 (B3) miss the top of the box but stages 4 & 5 are knocked out.
Strategy 1 (Gate AB):
HIT
Strategy 2 (BOX)
Hit
Miss
Hit BC
Miss BC
Hit AD
Miss AD
Over ToW
Under Tow
Strategy 1 (Gate AB)
MISS
Strategy 2 (BOX)
Hit
Miss
Strategy 1 (Gate AB)
Over
Strategy 2 (BOX)
Hit
Miss
Strategy 1 (Gate AB):
Under
Strategy 2 (BOX)
Hit
Miss
If you forecast the price will hit the box opening (AB) then the trader must make a choice between 8 different alternatives.
If you think the price will MISS the box, i.e. not hit the line AB, or go OVER B or UNDER A, then the trader has just two choices, Hit or Miss the box
CLOSE OUT is always available.
POT OF GOLD
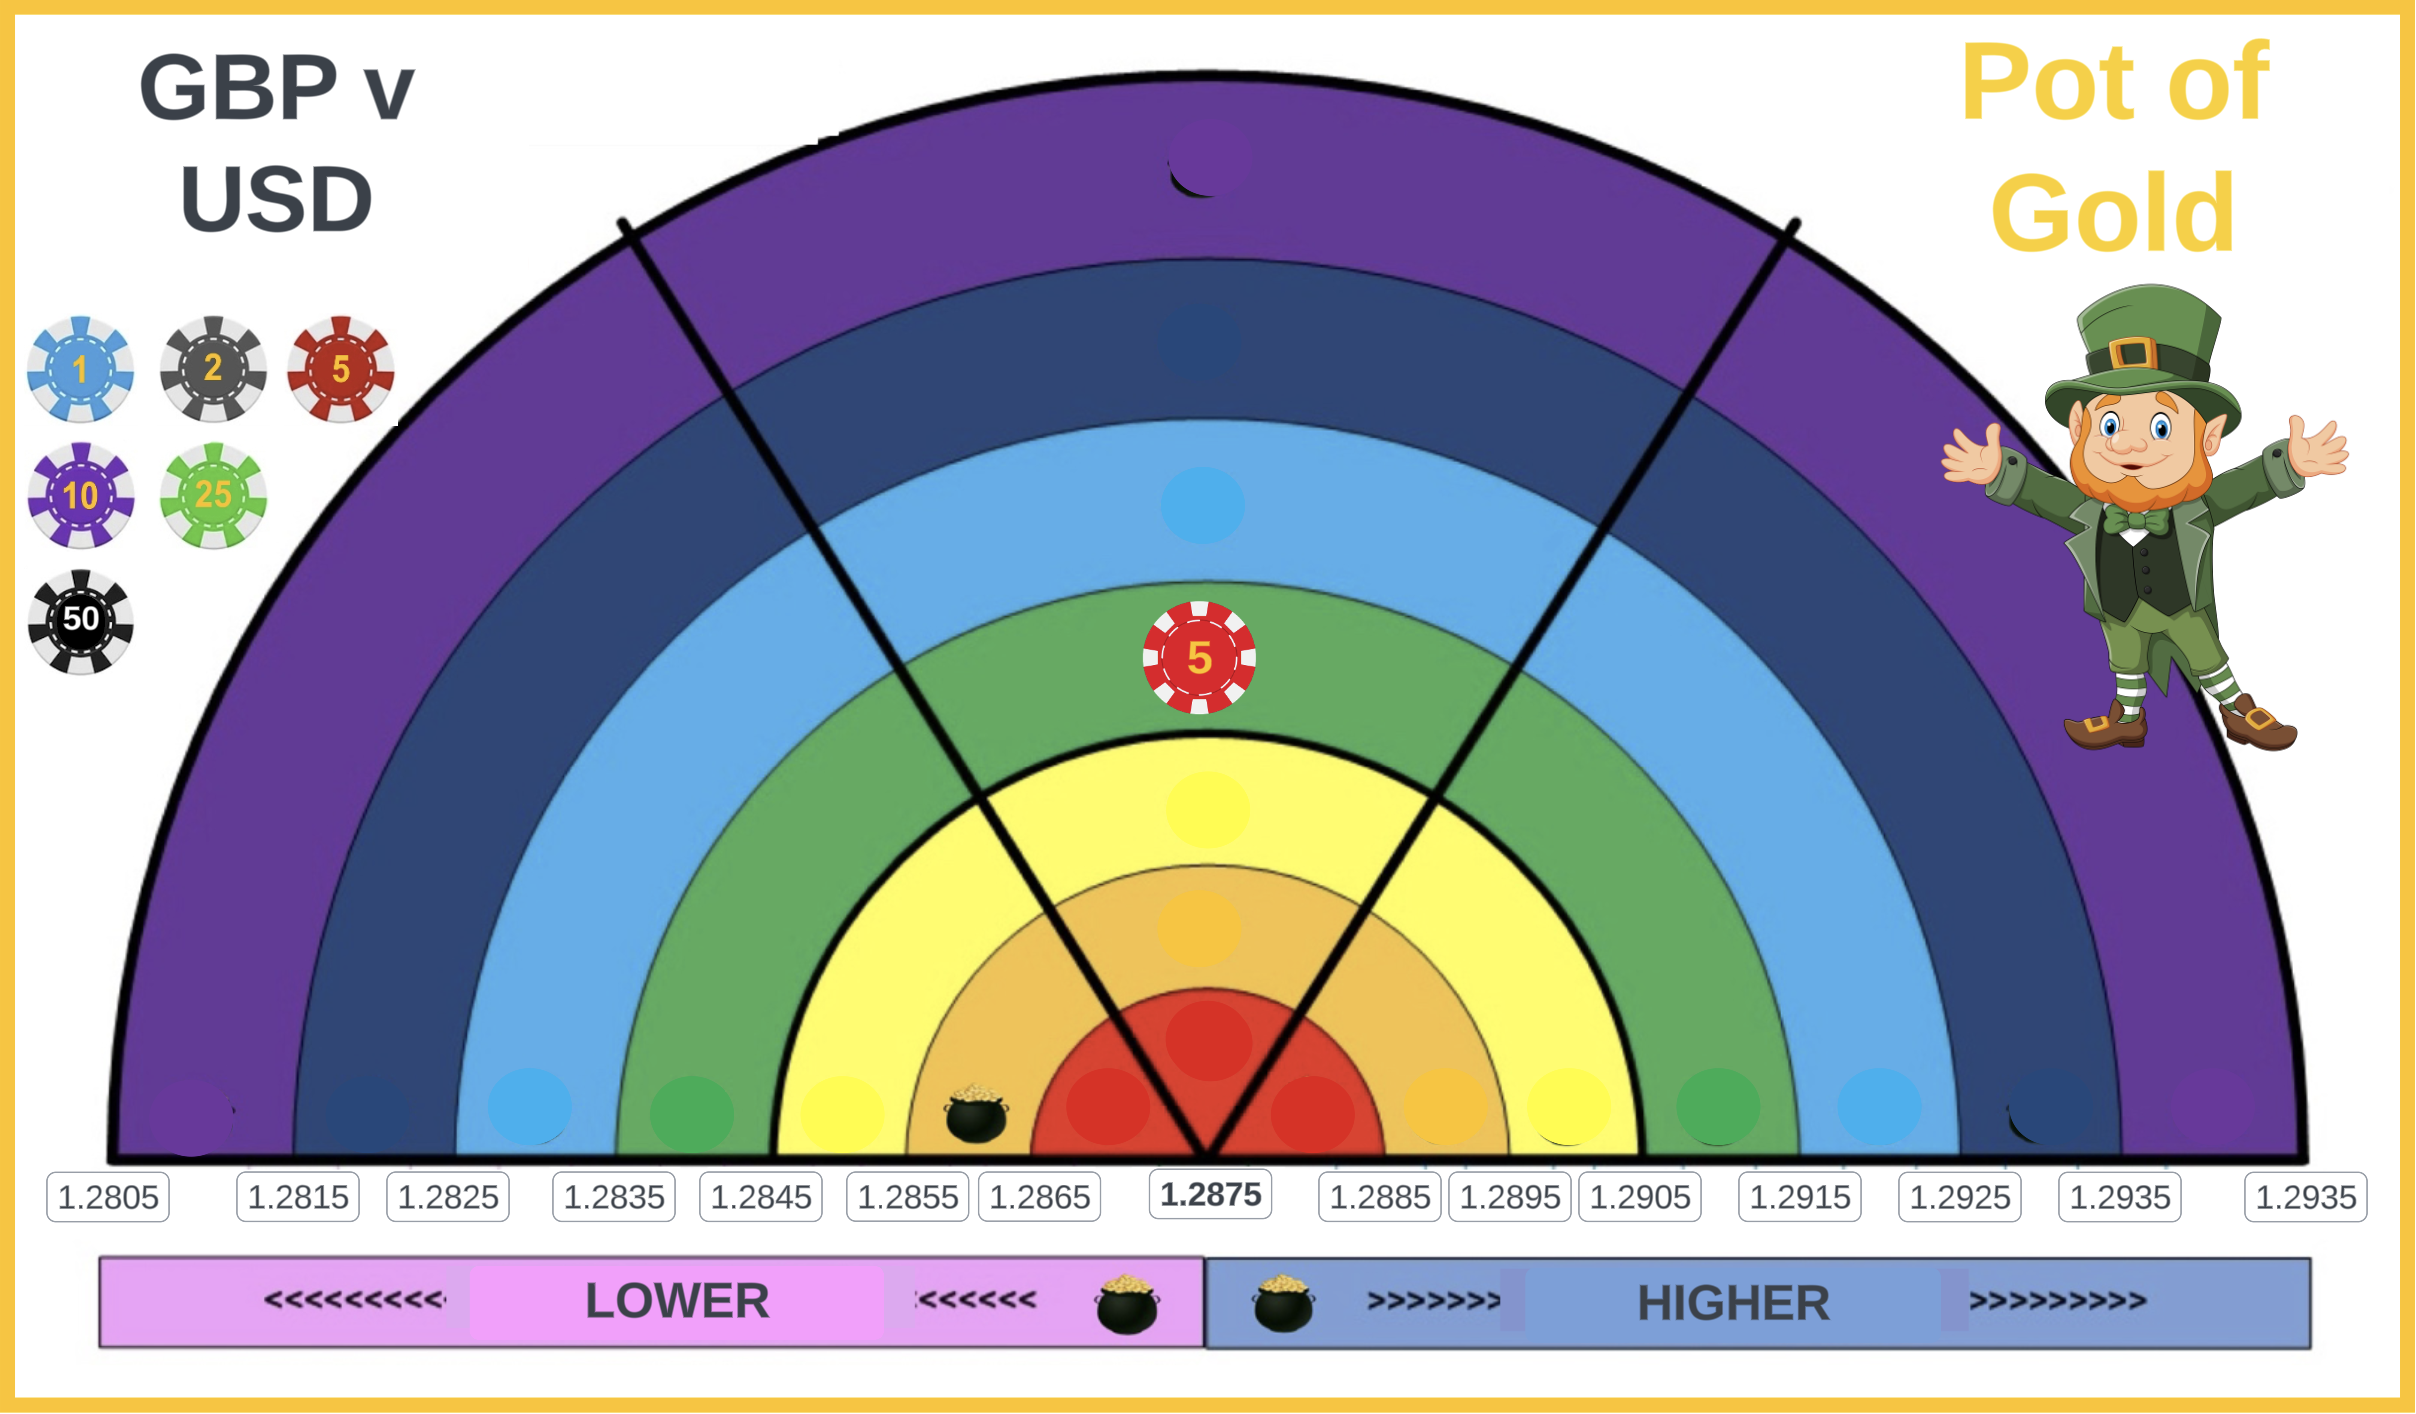
Pot of Gold is another game with a gamified bent. Nevertheless, there are a total of 83 different strategies the trader can put on.
The ‘5’ chip is placed on the green between the ‘V’-shaped black lines emanating from the current price. This means the trader is forecasting the pot-of-gold will jump out of the rainbow between 1.2835-1.2845 or between 1.2905 and 1.2915.
The actual price at expiry was between 1.2855 and 1.2865 since that is where the pot-of-gold revealed itself at expiry.
Prior to expiry a mini leprechaun was running too-and-fro just under the prices looking for the pot-of-gold and he represents the price. So if the price GBP v USD was trading at 1.2897 then the leprechaun would be situated at that point.
The trader can put a number of individual strategies into their basket.
Example 1, if the trader thinks volatility will collapse then they can just click red between the ‘V’ and he is forecasting the price will be between 1.2865 and 1.2885 at expiry.
But that trader may think that is too aggressive so adds the orange between the ‘V’ to their basket. The trader is now betting the price will be between 1.2855 and 1.2895 at expiry.
Example 2, the trader fancies the price lower. The simple choice would be to hit the pink bar below the rainbow. But the trader does not believe the price will breach support at 1.2835 and chooses to pick lower segments green, yellow and orange for a better return. The player will now win if at expiry the price is between 1.2835 and 1.2865.
SUMMARY
The above games are just a flavour of what exotic options can bring to the retail trading room.
The concepts are coming thick and fast and as would be the norm the graphic designers, coders et al can’t keep up.
Trading Games has probably two full years of games that have been mathematically modelled and coded in a low level language and are awaiting the artists, designers, UX specialists and Elixir coders to turn the games out.